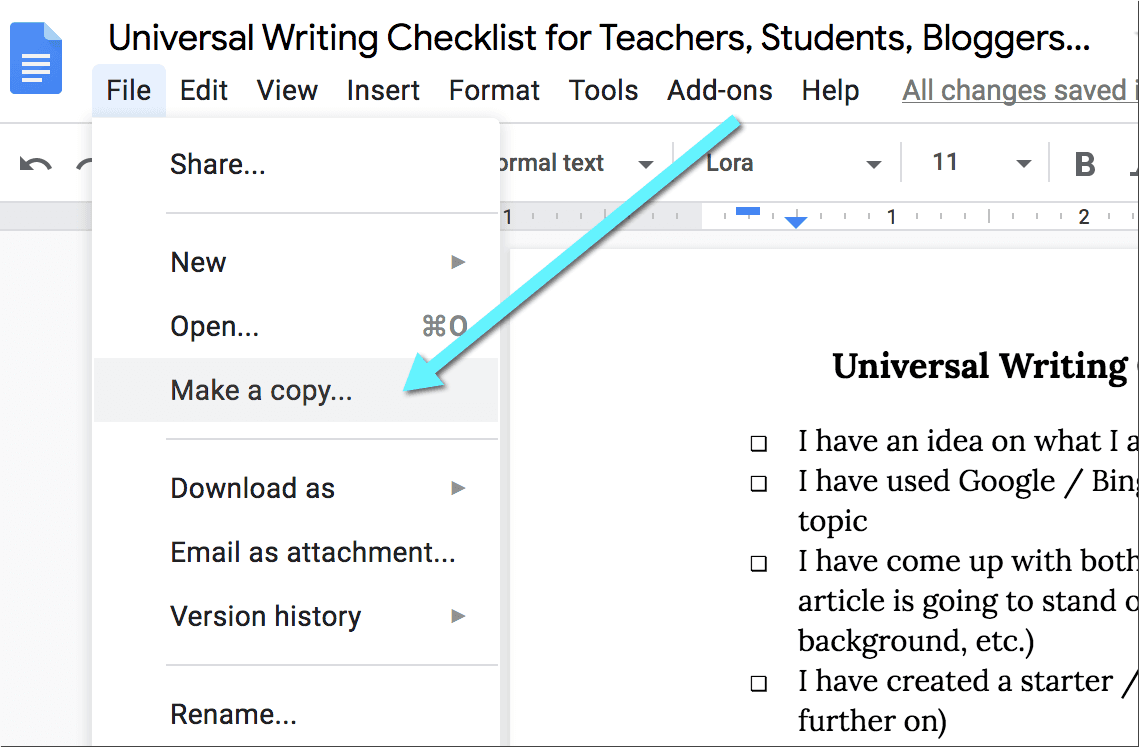
A writing checklist is a great way to become a better writer by helping you organize your ideas, revise and proofread your content and improve your writing style. Writing is one of the most creative activities there. Yet, it’s not really doable […]
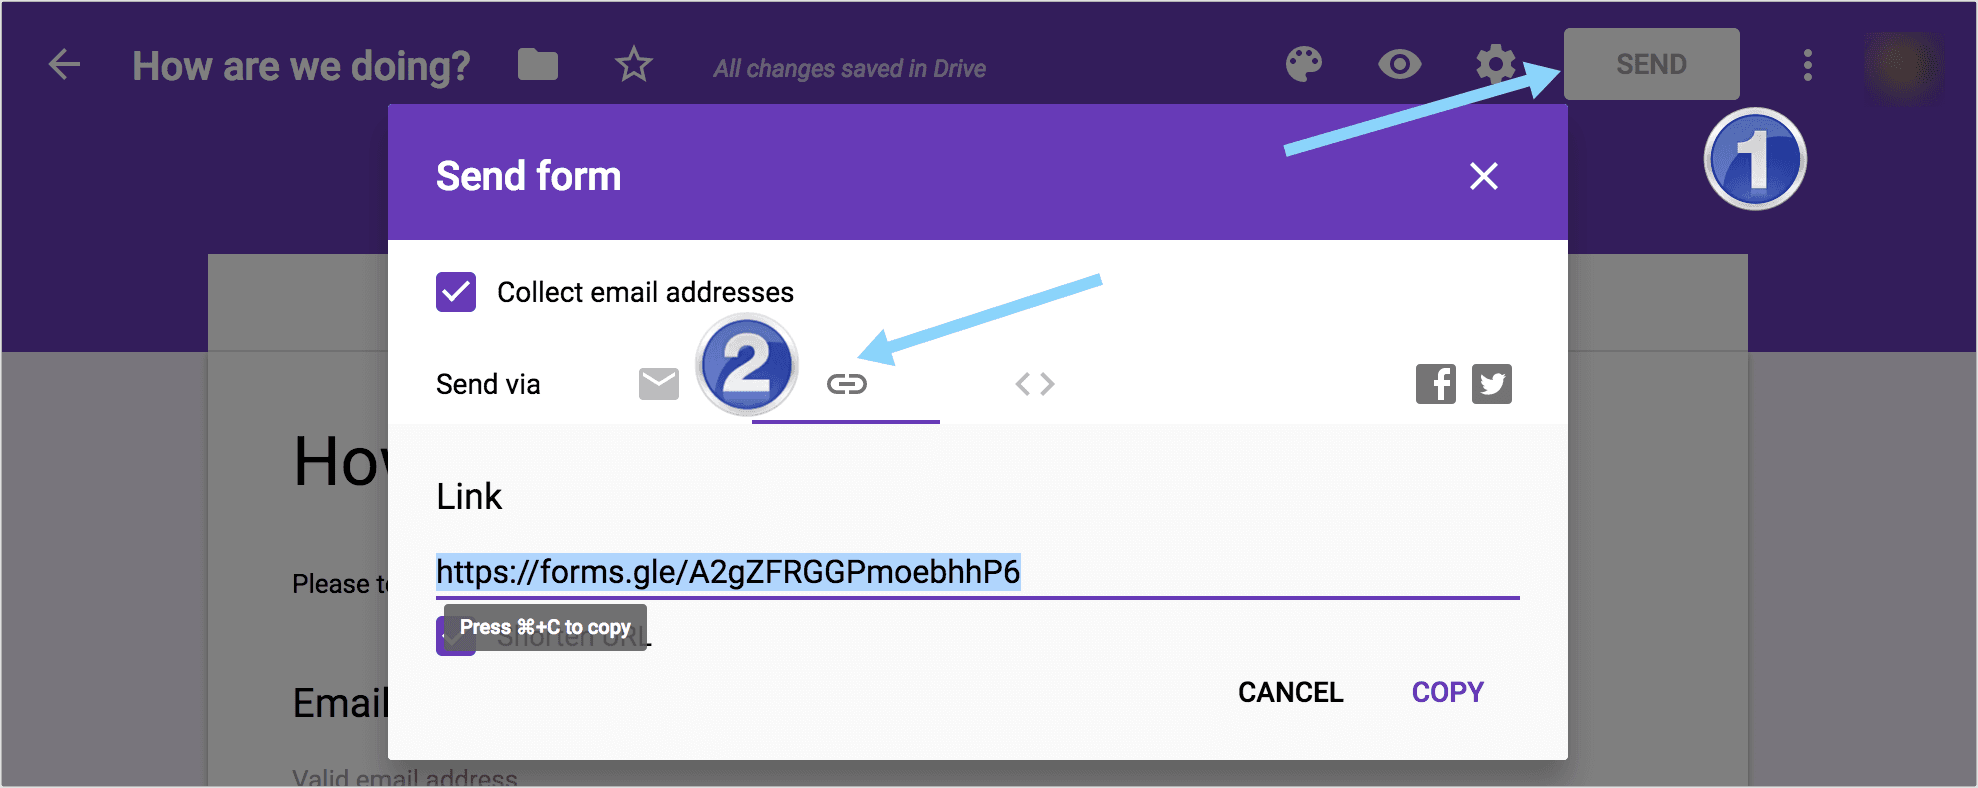
Google Forms are pretty awesome: They are free to create and free to share, so you can easily create simple surveys to collect data for your research paper or an article. But how to share your Google form in order to obtain […]
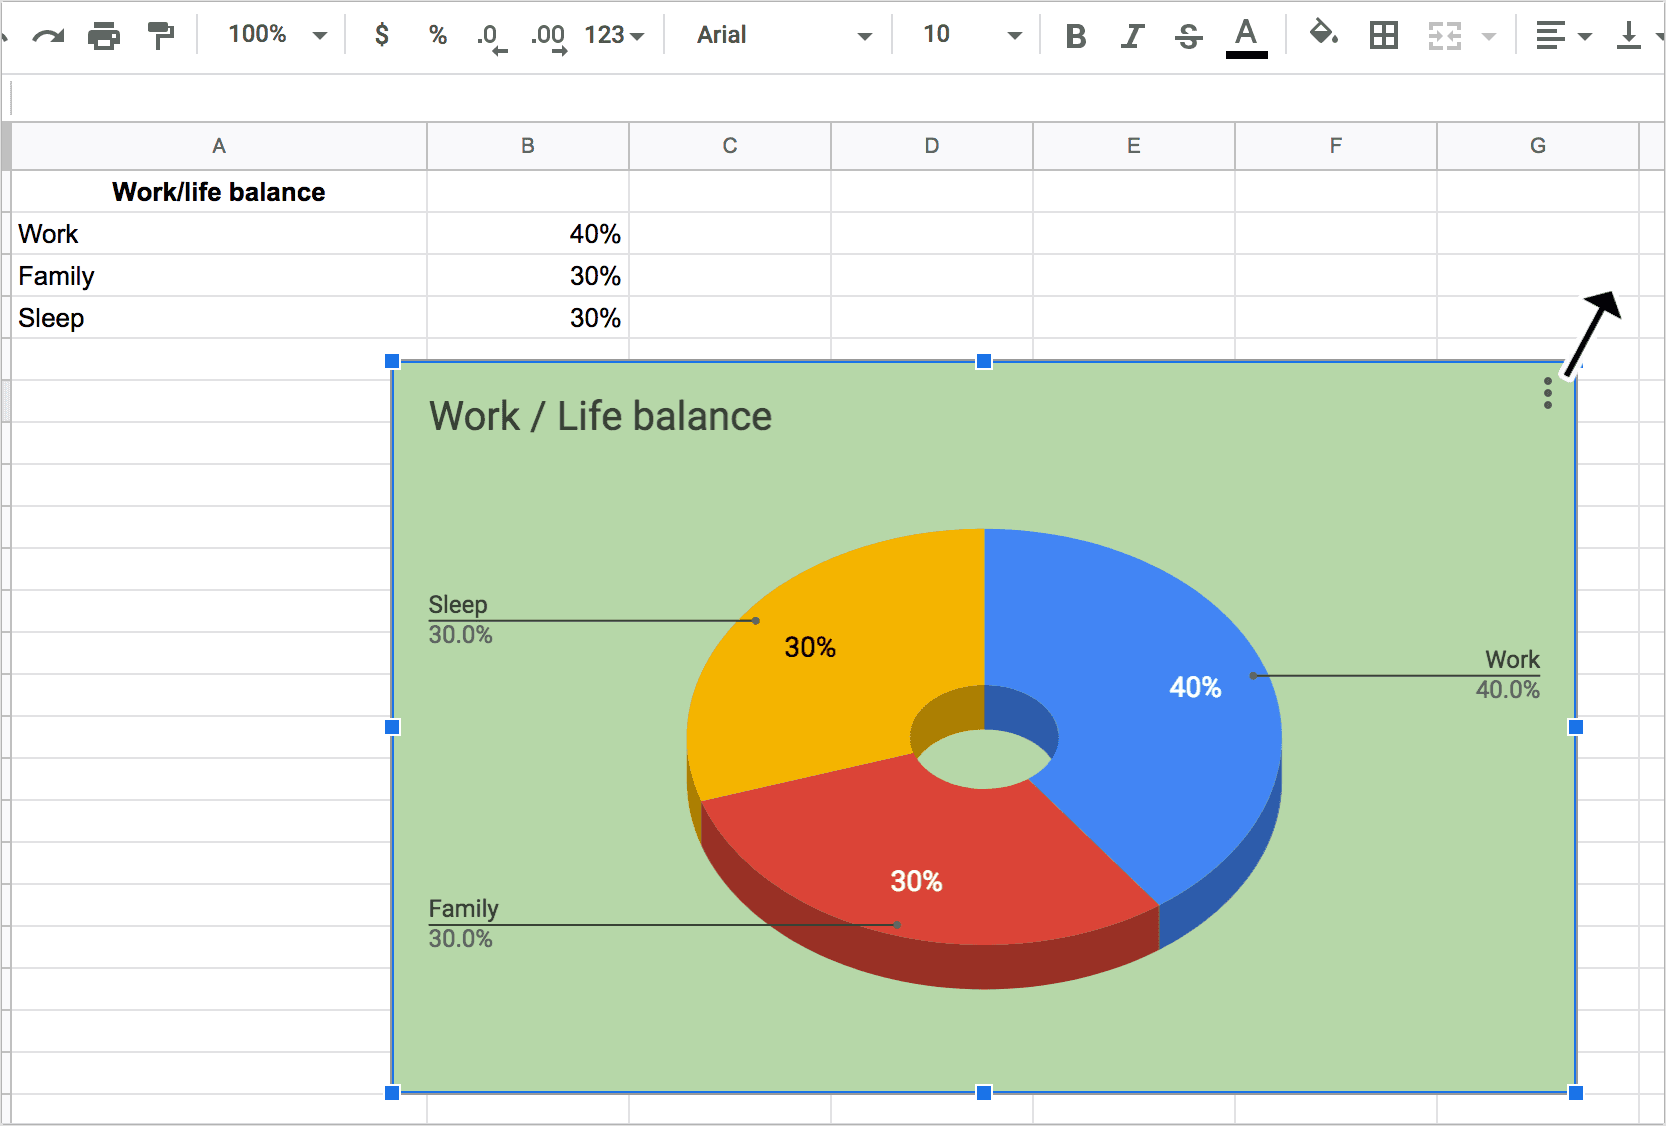
A pie chart (or a circle chart) is a graphical representation of data that looks like a circle is divided into sectors each of which represents a proportion of the whole. You can use Google Docs to design pie charts for free. […]
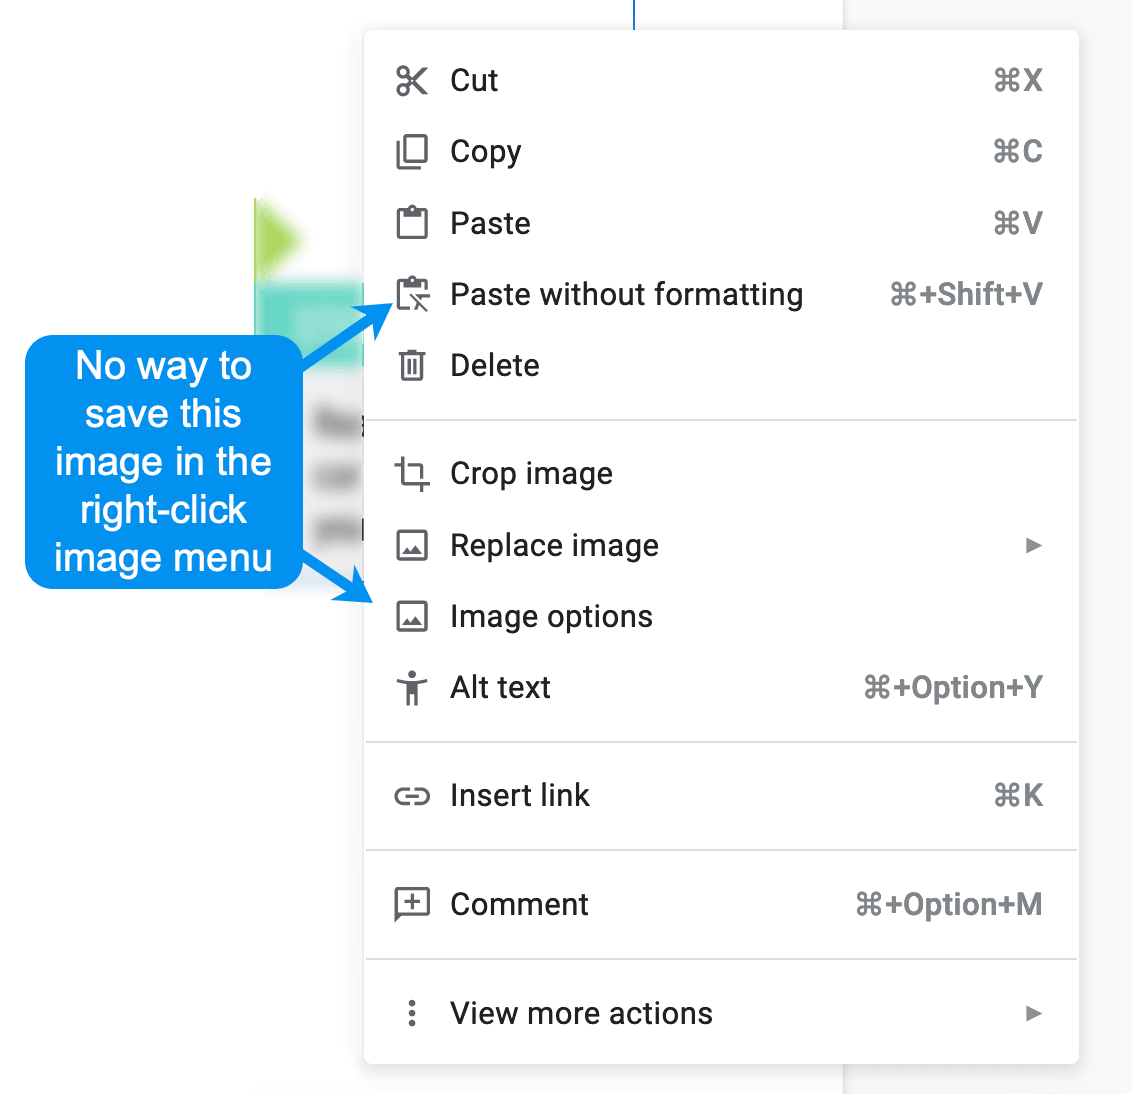
Google Docs is a great platform: It is free, fast and reliable. Yet, it has some weird usability issues that haven’t been addressed for years. One of such issues is an ability to save an image from a Google Doc. As Google […]


